

Market Statistics
2019

2018
Here’s your 2018 Real Estate Breakdown for Klamath County:

Some interesting updates for November in our market across all property types when compared to last year.
-For residential sales we've sold a bit less inventory but at a higher average price.
-We've sold quite a bit more land, but at a much lower price.
-Multi-dwelling sales & price are both much less than 2017
-Farm sales remained consistent, but at a lower price
And taking a look at year-to-date, all categories are up from last year with the exception of multi-dwelling sales price. Check back next month to see where we end up for the overall year!

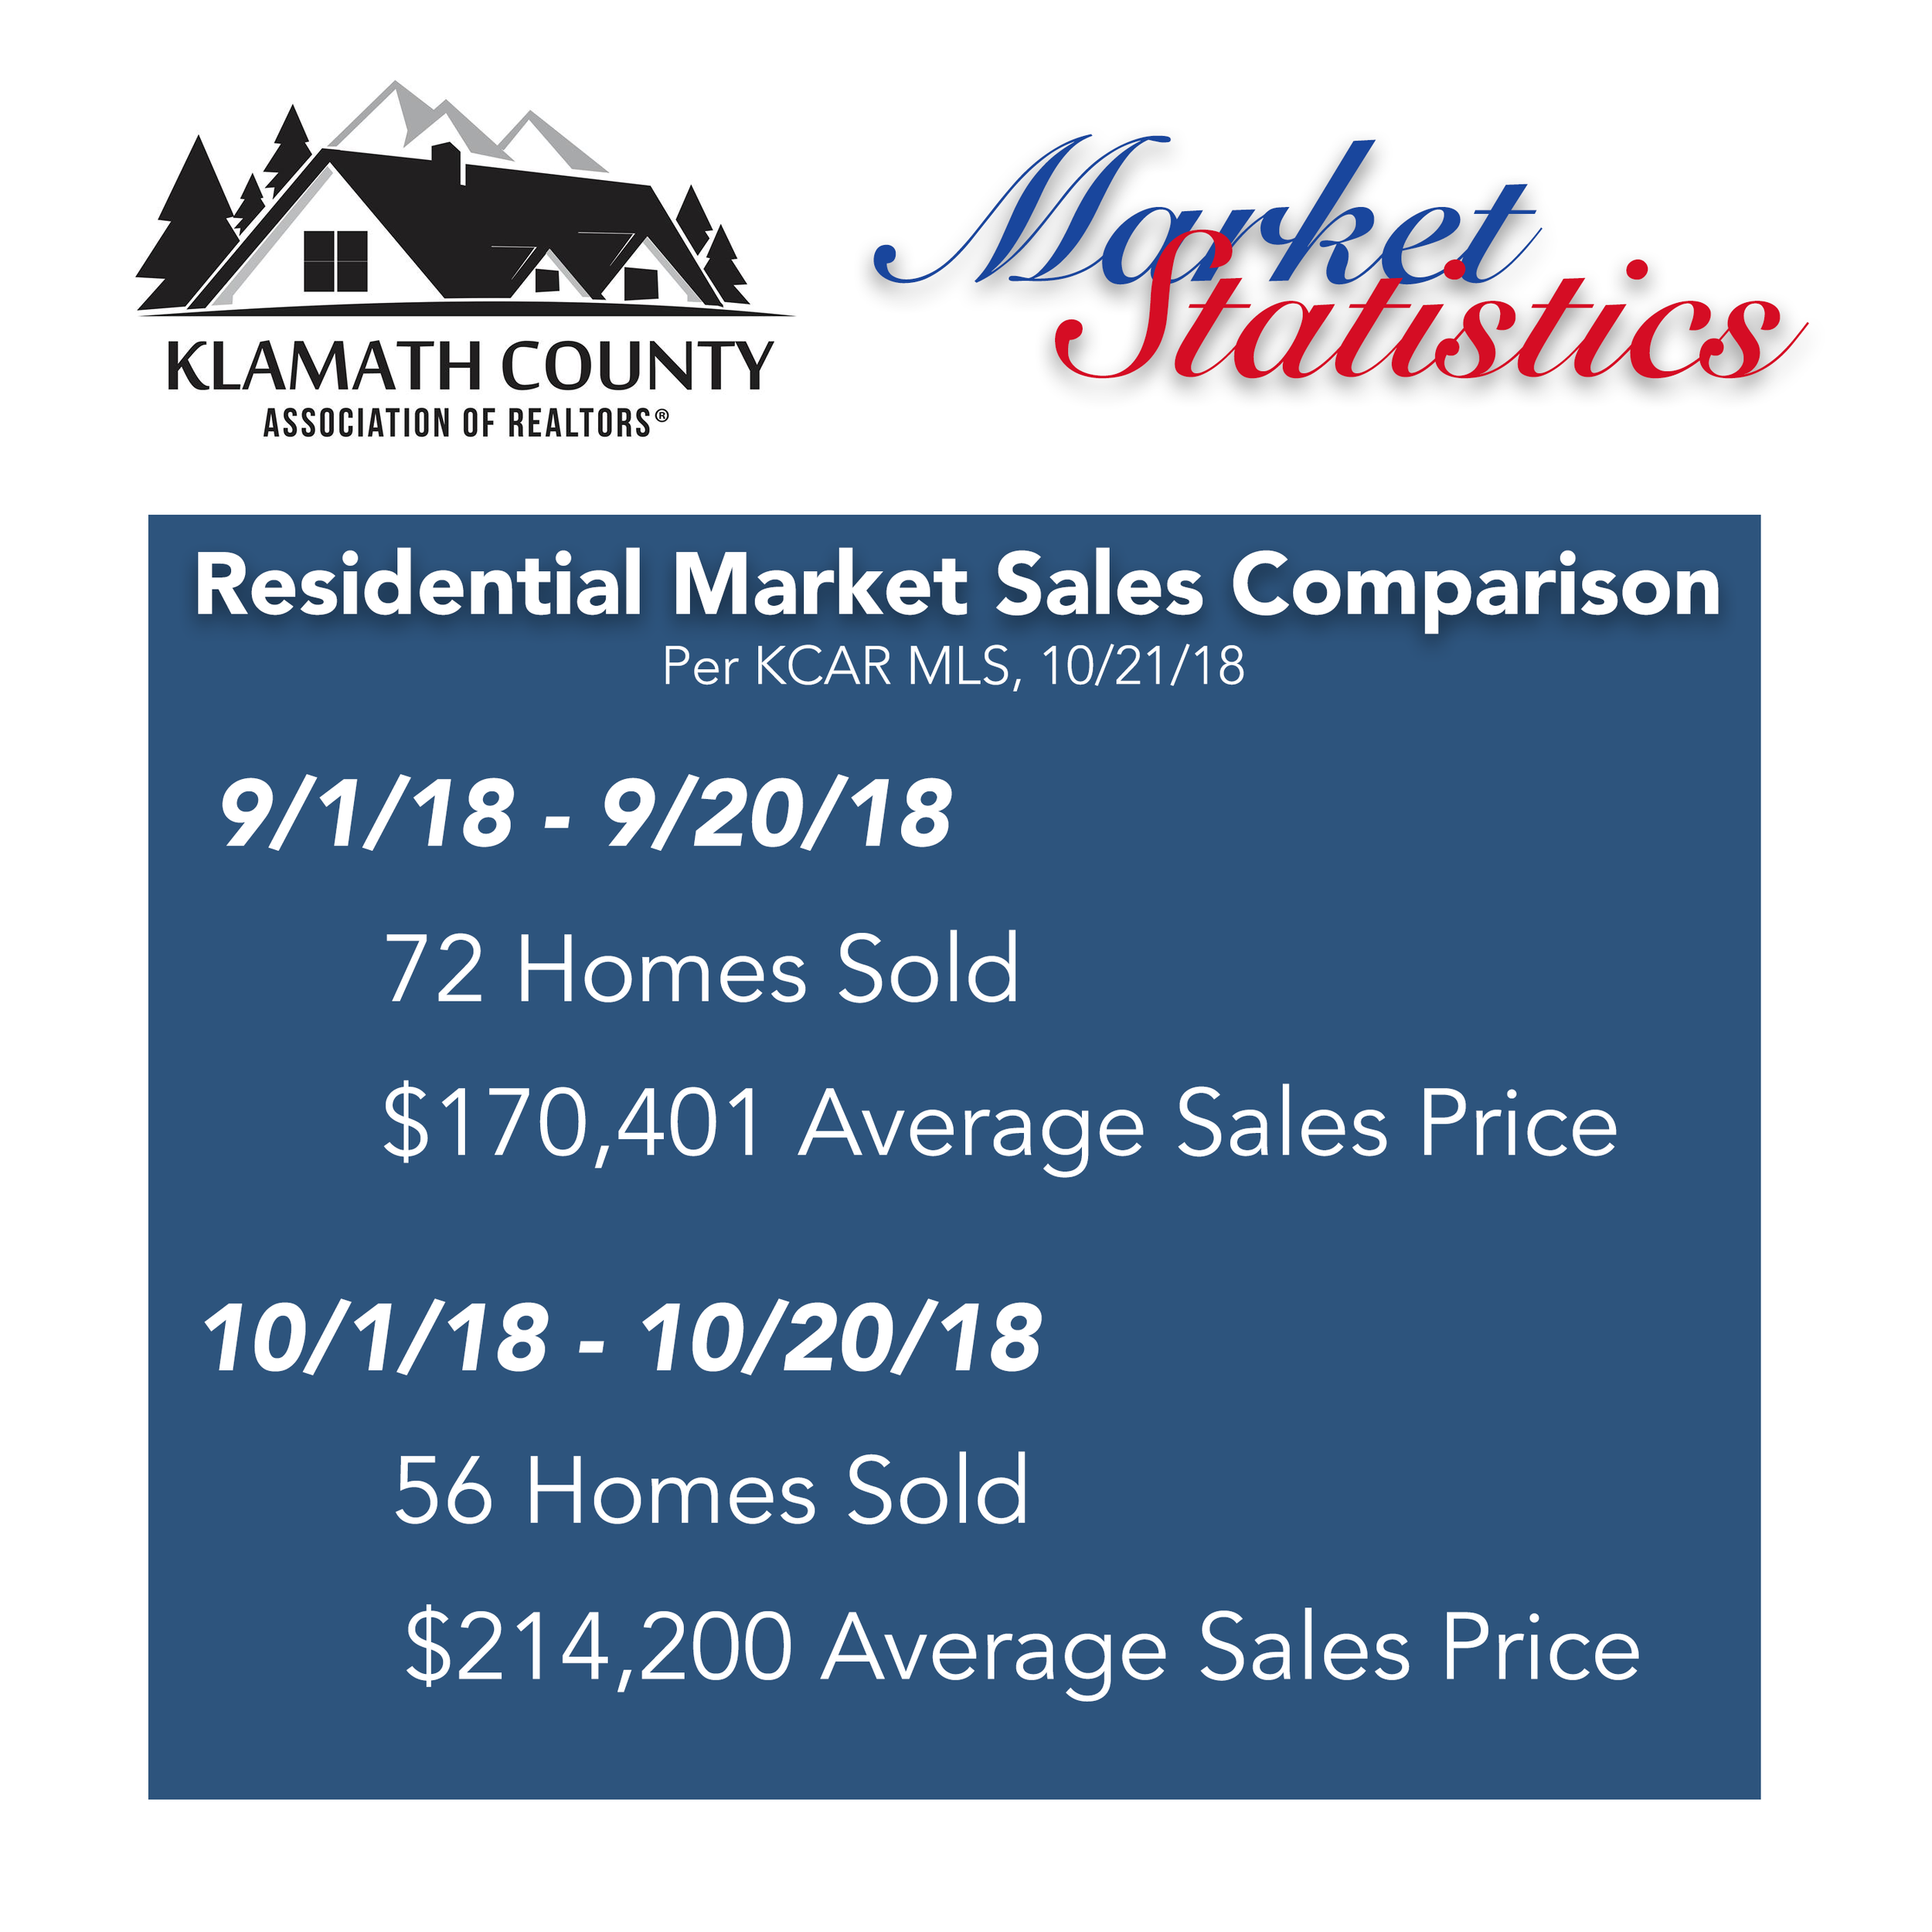
When we compared October’s residential sales to September’s residential sales, we found out that 16 less homes were sold but the average sales priced climbed over $40,000. Take a look:
Below are market stats for residential listings, pending & sold transactions from Jan 1, 2018 - Sept 28, 2018 (3pm) as obtained from the KCAR Multiple Listing System.

